Course Dashboard
The dashboard provides statistics about course participation and engagement across the entire cohort.
This is not your personal progress page. It shows aggregate statistics for everyone taking the course.
Participation Statistics
The dashboard tracks how students are engaging with the course material:
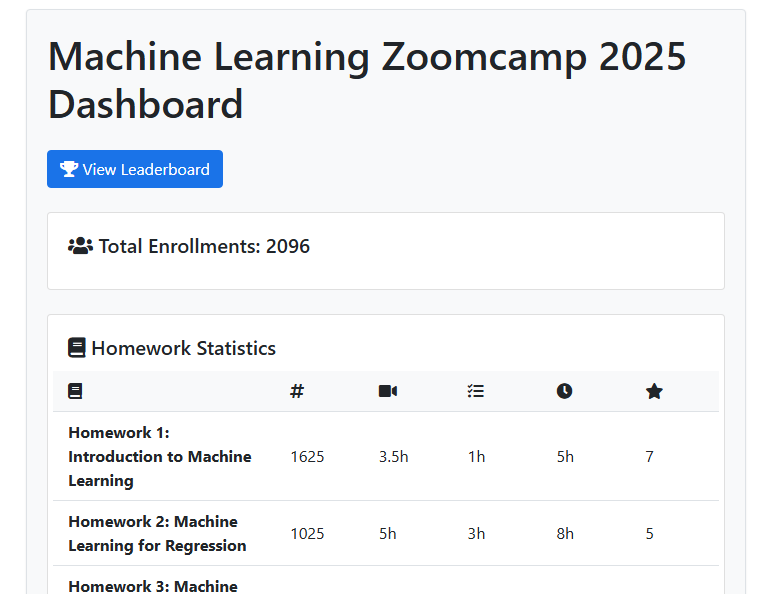
Homework Statistics
A table for each homework assignment showing:
- Number of submissions
- Average time spent on lectures
- Average time spent on homework
- Average total time invested
- Score to pass (minimum correct answers needed)
Project Statistics
Overall capstone project participation:
- Total project submissions
- Completion rate percentage
- Number of students passed and failed
- Average project score
Cohort Overview
- Total enrollments - Number of students registered for the course
Access Your Dashboard
Log in to your course platform: