It’s a common misconception that MLOps is solely about the tools we use for deploying models and preparing the infrastructure for it. Partly it is, but it’s not the whole story — there’s much more. In this post, I’ll break down a machine learning project into several stages and explain how MLOps helps at each of them.
MLOps is a new topic and there’s no consensus on what it is or what it is not. In this post, I’ll share my personal take on it. You don’t have to agree with it, but I hope it’ll still be useful.
So let’s start!
MLOps
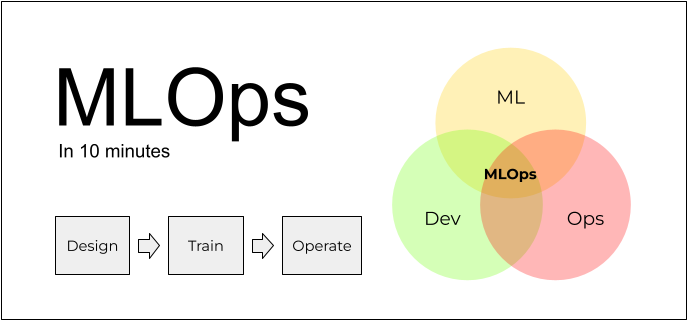
MLOps is a set of practices of putting machine learning in production. Let’s see what they are.
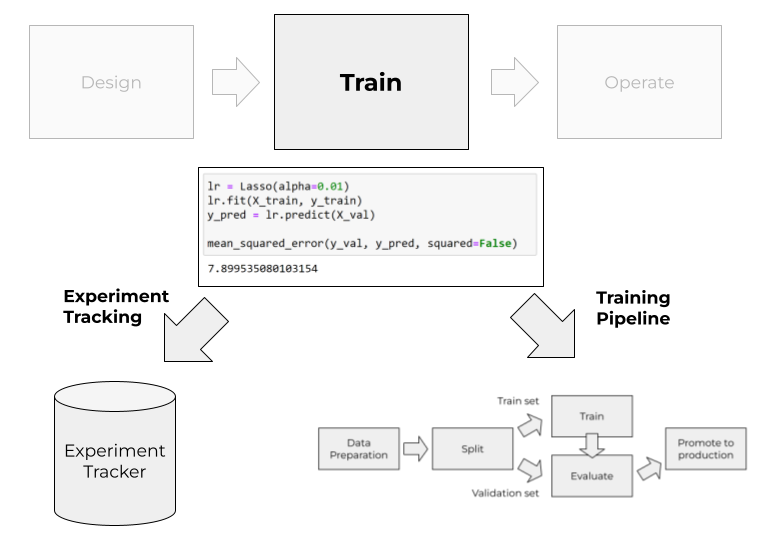
To do it, we’ll start with a helicopter view of a typical process for ML projects. In the simplest form, it consists of 3 stages:
- Design
- Train
- Operate
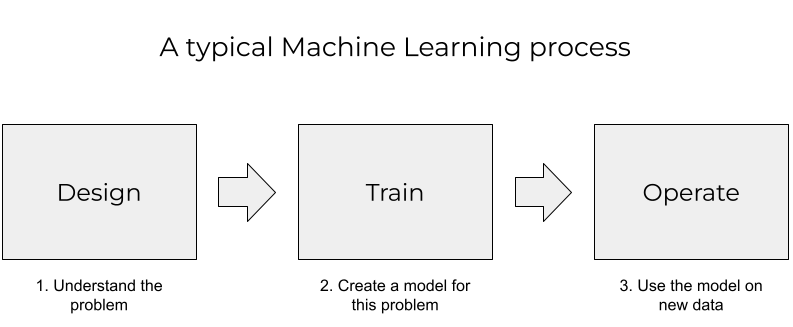
It starts with the design stage: we understand what the problem is and decide if ML is the right solution for that.
If we think we need ML, we train the model. This is the train state.
When it’s ready, we need to apply the model to new data regularly. This is the operate stage.
Train
In the train stage, we experiment with different models and try to find the best set of parameters and features for the model.
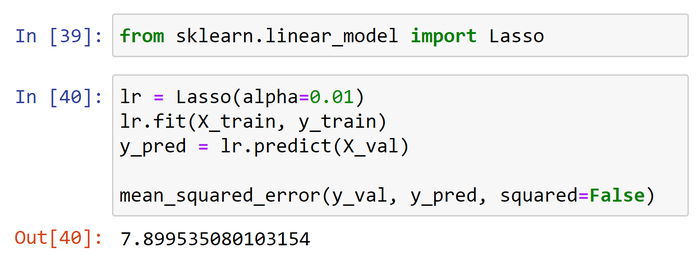
Most data scientists do it in Jupyter notebooks.
The typical process for experimenting is “change a parameter → re-execute the cell → see if the results improve”. After a few iterators, it makes the notebook a total mess: you can’t easily track the changes, the parameters and the results. Also, it becomes non-trivial to reproduce these results later.
Two things help us deal with these problems:
- Experiment tracking
- Training pipelines
Experiment tracking
In experiment tracking, we establish the process of saving the results of each experiment. Each time we experiment with a new set of parameters, or with a new feature, we log the parameters and the results with an experiment tracking tool. Later we can use it for seeing which settings led to the best model and how different parameters compare with each other.
There are many tools for tracking experiments. The most popular one is MLFlow.
Training pipelines
Experiment tracking doesn’t solve all our training problems. We still have messy Jupyter notebooks with cells that need to be executed in a specific order to get the final solution.
To solve it, we decompose the notebook into a set of building blocks executed one after another. We call a sequence of such blocks as a “machine learning pipeline”.
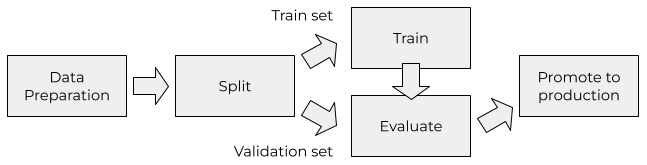
Once we express the training process as a pipeline, we can execute it and retrain the model on new data with just one click. Or without any clicks at all.
In practice, you do it by converting the notebook into a Python script and then breaking it into several functions. For more advanced pipelines, you can use general-purpose workflow orchestrations tools like Airflow. There are also specialized ML-focused tools like Kubeflow Pipelines.
To summarize, in the training stage, MLOps helps with reproducibility and automating model training and evaluation.
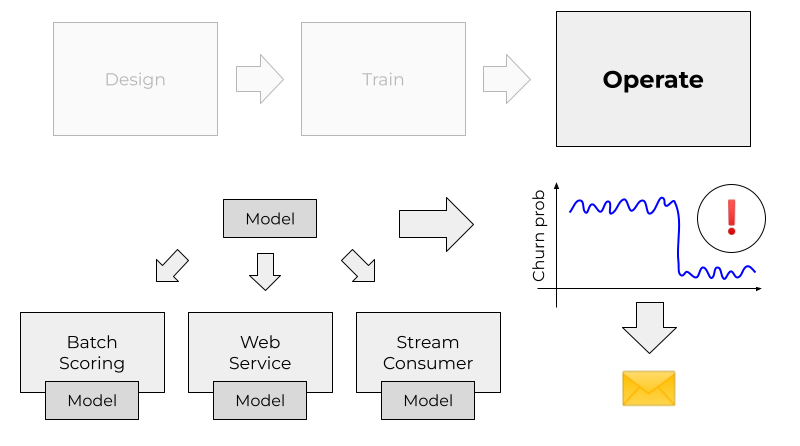
Operate
The output from an ML pipeline is a model — often a pickle file. Now we need to take the model and start applying it to new data.
This process is called model deployment.
Deployment
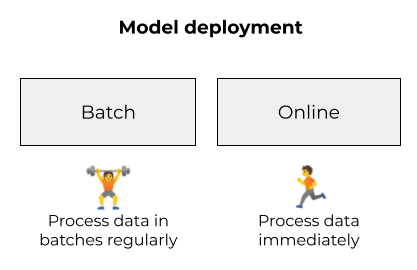
Depending on a use case, we can deploy our model in two ways: batch and online.
In the batch mode, we don’t need to immediately react to all new data. Instead, we process the data regularly in batches. For example, we can execute it every hour, every day or once per week.
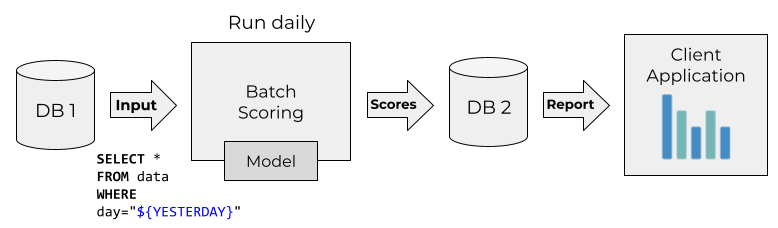
We run training pipelines in a batch mode as well, that’s why batch deployment typically becomes an extension of ML pipelines. Often we just use simple Python scripts that can be executed as Kubernetes jobs or AWS Batch jobs. Or, quite often, we might use Spark for that.
The batch mode is the most common way of using ML models. It’s simple and sufficient for a lot of cases.
In contrast to batch, in the online mode we need to react to new data as soon as it appears. It’s usually more complex than batch because the model services need to be always up and running, ready to process new data all the time.
We can further break down the online case into two ways of deploying ML models: web services and streaming.
In the first one we deploy the model as a web service. The users of our model send HTTP requests with features (typically in JSON format) and get back the predictions.
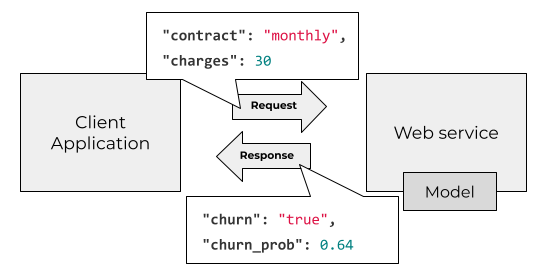
For deploying models as web services we use libraries like Flask or FastAPI and run them on Kubernetes or a similar system. There are also more specialized ML-oriented solutions like KServe.
In the streaming case, our model becomes a consumer of an event stream.
Every time there’s a new event, the service reacts to it and applies the model. The predictions are saved to another stream. Our users now can subscribe to the output stream and make decisions based on these predictions.
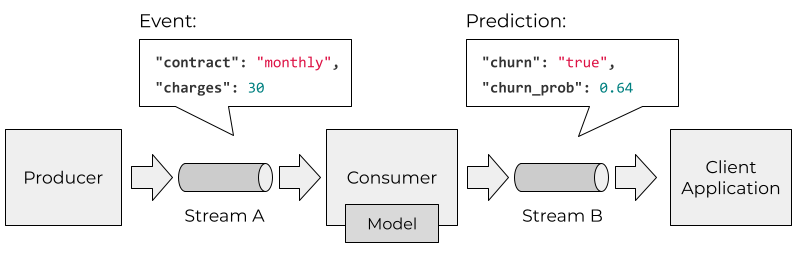
Typically we use message brokers like Kafka for streaming and implement the model service as a Kafka consumer. Instead of Kafka, we can use other streaming platforms like Kinesis.
Model monitoring
Our job doesn’t end when the model is deployed. When it goes live, we need to keep an eye on it and make sure it remains functional.
First of all we monitor the traditional “DevOps” metrics:
- CPU unitization
- memory
- network usage
- the number of requests per second
- and others.
If some metric exceeds a threshold, we send an alert to the support team, who quickly reacts to these problems and fix them.
But that’s not enough. We also need to make sure that the predictions of our model are still good and the model doesn’t become stale. That’s why we need model monitoring.
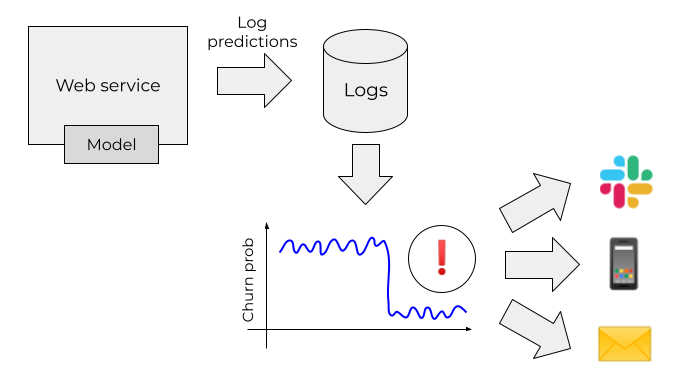
If we detect that the performance drops, we can trigger the training pipeline and retrain it on the fresh data.
To summarize, in the operate stage, MLOps helps us deploy the model and monitor its performance.
People, processes and best practices
So far we discussed the practices and tools for training and operating. That’s already good but not sufficient.
First of all, we need to make sure we understand the problem we want to solve and make sure ML is the right solution. We need to be methodical about it: start with the goal, come up with a baseline, then gradually improve it. We don’t always need a full-blown training pipeline in Kubeflow with the model deployed in KServe and the state-of-the-art monitoring system. Instead, we often need to start simple and first show the value in the project — and then iterate.
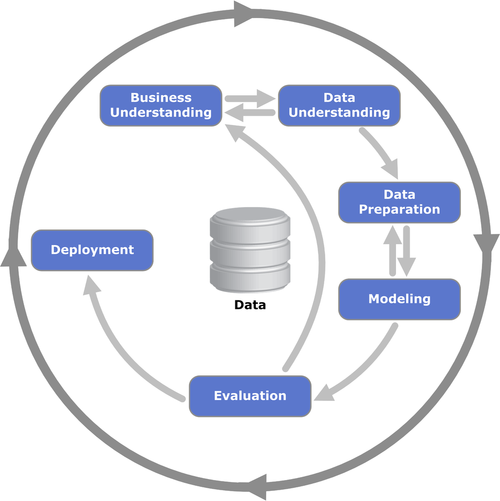
Processes help us with that. There are tools and frameworks like CRISP-DM, ML Canvas and MLOps Canvas that help us work together and solve the problems.
MLOps is “DevOps for Data Science”. This means that all the DevOps practices still apply:
- Testing our services with unit and integration tests
- Automating everything
- CI/CD
- Using templates to get started quickly (e.g. cookie-cutter) and makefiles
- Writing comprehensive documentation
Both processes and best practices help us in all the three states of the project.
There’s more
In this article, we only scratched the surface. There are more concepts that I didn’t cover here:
- Feature stores
- Model registries
- Experimentation platforms
And possibly much more. You can read more about them and see which problems they solve and which stage they belong to (hint: some can belong to multiple).
Summary
We discussed what MLOps is and looked at the helicopter view of the process. We broke down the process into 3 stages: design, train and operate.
For each of these stages we saw how MLOps helps:
- Processes help us work together and make sure we bring value
- Experiment tracking helps us stay sane when trying different model parameters
- Training pipelines make it easier to reproduce results and retrain the model with just a few commands
- Model deployment takes care of using the model in the best way — either in a batch mode, as a web service or as a part of a streaming thing
- Model monitoring alerts us when the model goes stale and we need to retrain it
- Best engineering practices keep our code clean and reliable
MLOps Zoomcamp
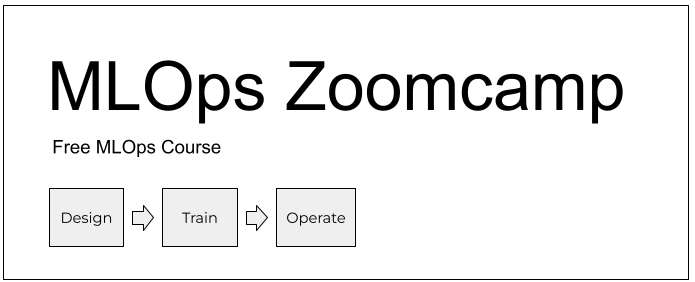
Are you interested in learning MLOps? At DataTalks.Club we launch a free online course. We will cover all the topics discussed here and teach you how to apply all these concepts in practice.
More information here: https://github.com/DataTalksClub/mlops-zoomcamp.
See you on the course!