In one of our previous articles, we covered the waste classifier built by ML Zoomcamp graduate Serena Haidar. This time, another graduate, Alexander Daniel Rios, walks through his final project: an end-to-end tool that segments and classifies blood cells from microscope images to assist in detecting signs of acute lymphoblastic leukemia (ALL).
Below, Alexander explains his approach, from problem framing and data preparation to modeling choices, evaluation, and deployment, and what it takes to make the system usable outside a notebook.
ML Zoomcamp is a free, four-month online course on core machine learning and taking models to production. A key requirement is an end-to-end capstone/final project that turns course concepts into a working system.
ML Zoomcamp Contribution
Before the course, my projects were scattered: messy notebooks, ad-hoc experimentation, and model switching without proper validation. ML Zoomcamp gave me the structure I was missing. The recorded lessons, assignments, and projects pushed me to build a professional workflow.
What I gained:
- Methodical data preparation and reproducible pipelines
- Proper validation for regression and classification
- Sensible metric selection tied to use cases
- Practical confidence with neural nets and transfer learning
- Lightweight deployment paths (Flask, AWS Lambda)
My Final Projects
I applied everything he had learned from ML Zoomcamp into several projects:
-
Capstone 1 – Predicting cancer in blood cells: the focus of this article.
-
Capstone 2 – Classifying disaster tweets: Another project using spaCy, TensorFlow, and BERT-based models for NLP. I covered it separately.
-
Kaggle Competition – ML Zoomcamp 2024 Retail Forecasting: A challenge to predict product demand for the next month using 25 months of historical retail data across multiple stores. My final model achieved 4th place globally, among dozens of participants.
In the rest of this piece, I walk through the blood-cell cancer project end-to-end.
Predicting Cancer in Blood Cells
The goal of my project was to develop an ML system capable of automatically classifying and segmenting blood cells from microscopic images to detect the signs of acute lymphoblastic leukemia (ALL), a type of cancer that primarily affects the blood and bone marrow, particularly in children.
Diagnosis of such patients still relies heavily on microscopic analysis by trained specialists. That process is complex, subjective, and time-consuming. It also assumes consistent access to experienced pathologists and well-equipped laboratories, resources that are not uniformly available. In practice, this makes it difficult to achieve a timely and consistent diagnosis in many regions.
Within this context, an automated approach like the one developed here is intended as a support tool. It can help standardize the routine parts of analysis, reduce turnaround time, and provide clear visual evidence for review, contributing to faster triage and more efficient patient care.
My Motivation
I’ve always been drawn to the application of data science in areas related to human health. Building a system that supports fast, efficient, and accurate diagnosis and can be used anywhere is my core motivation.
The system focuses on turning raw images into clear, structured outputs that a clinician can review: where the cells are, which ones look suspicious, and a concise summary of the findings.
Key Goals of this Project
The goal of this project is to develop an end-to-end system that delivers accurate predictions through an intuitive and accessible interface. Specifically:
- Automate cell classification with high accuracy
- Reduce sample analysis time
- Visually identify affected regions
- Make the technology accessible through a simple interface
- Deploy the system in a scalable way across different environments
Tools and Technologies Used
Here’s a workflow behind this project with the tools used in each step:
- Develop and evaluate models in Python with TensorFlow/Keras
- Use OpenCV/Matplotlib and scikit-learn for preprocessing, analysis, and metrics
- Package the model and services with Docker
- Orchestrate locally with Kubernetes/Kind
- Serve the trained model via TensorFlow Serving
- Expose predictions through a REST API built with Flask/Waitress
- Present results in a simple Streamlit web app.
My resulting project combines deep learning models, computer vision techniques, and an accessible user interface, providing an end-to-end path from microscope image to clear, reviewable output.
Dataset Selection
I used the Blood Cell Cancer ALL 4-Class dataset. The images were prepared at the Bone Marrow Laboratory of Taleqani Hospital in Tehran, Iran.
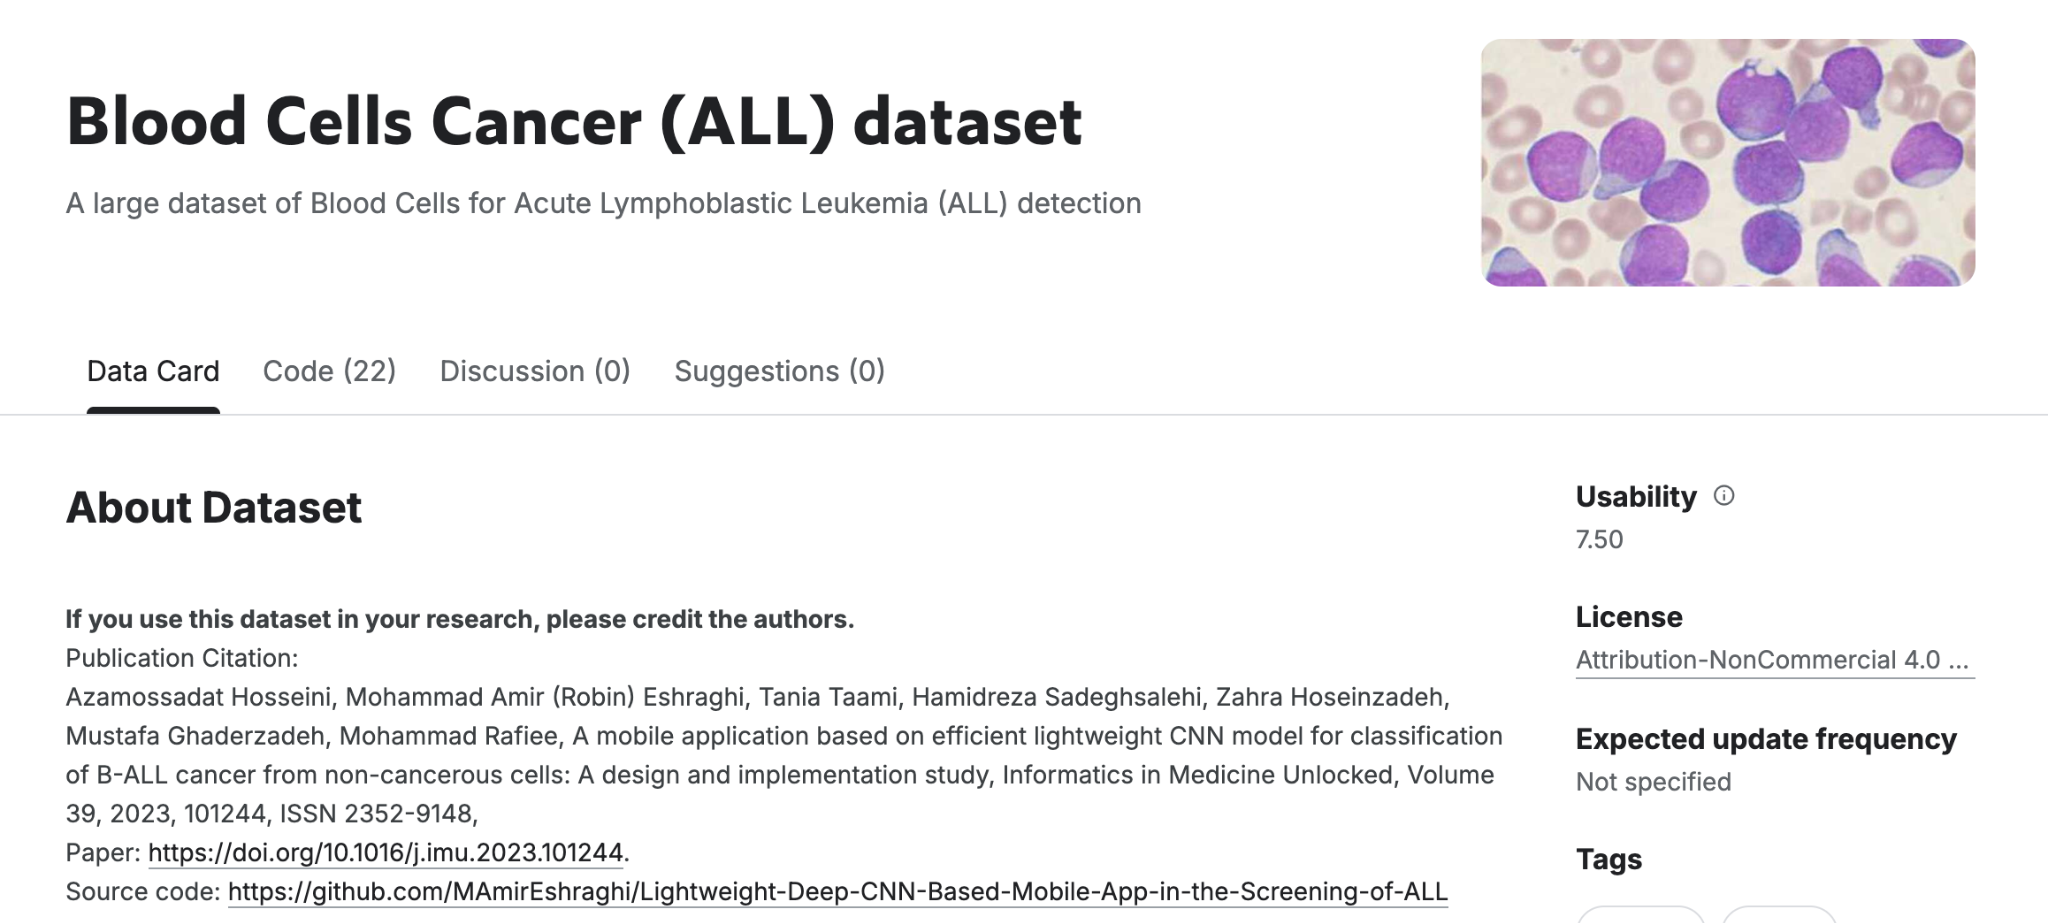
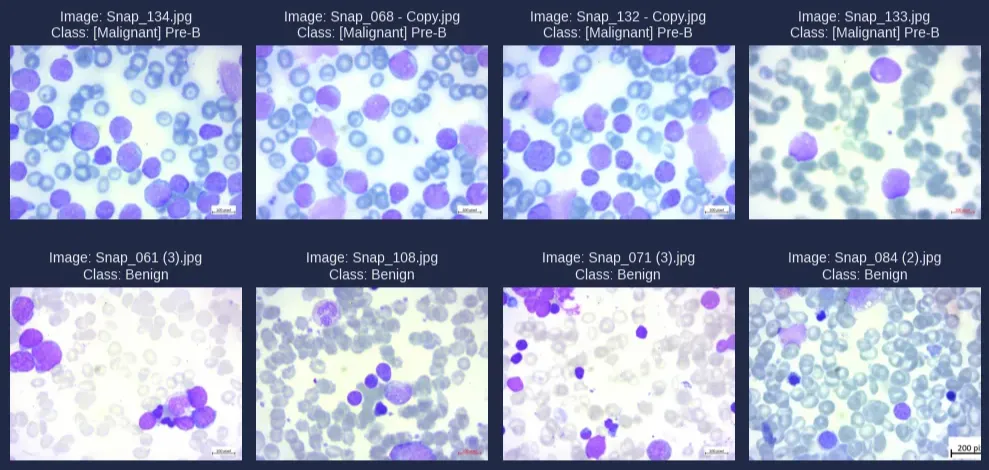
The dataset includes 3,242 peripheral blood smear (PBS) images from 89 patients suspected of having acute lymphoblastic leukemia (ALL). It is divided into two main classes:
- Benign: normal hematopoietic cells
- Malignant: ALL-related cells, categorized into three subtypes of malignant lymphoblasts:
-
Early Pre-B
-
Pre-B
-
Pro-B
-
All images were captured using a Zeiss camera mounted on a microscope at 100x magnification and saved as JPEG files. A specialist performed the final classification of cell types and subtypes using flow cytometry. Additionally, segmentation masks were included to facilitate training of models capable of visually identifying tumor regions.
Preprocessing
Before training any artificial intelligence model, it is essential to perform proper data preprocessing. This step helps standardize and optimize the model’s input, enhancing its learning ability and overall performance.
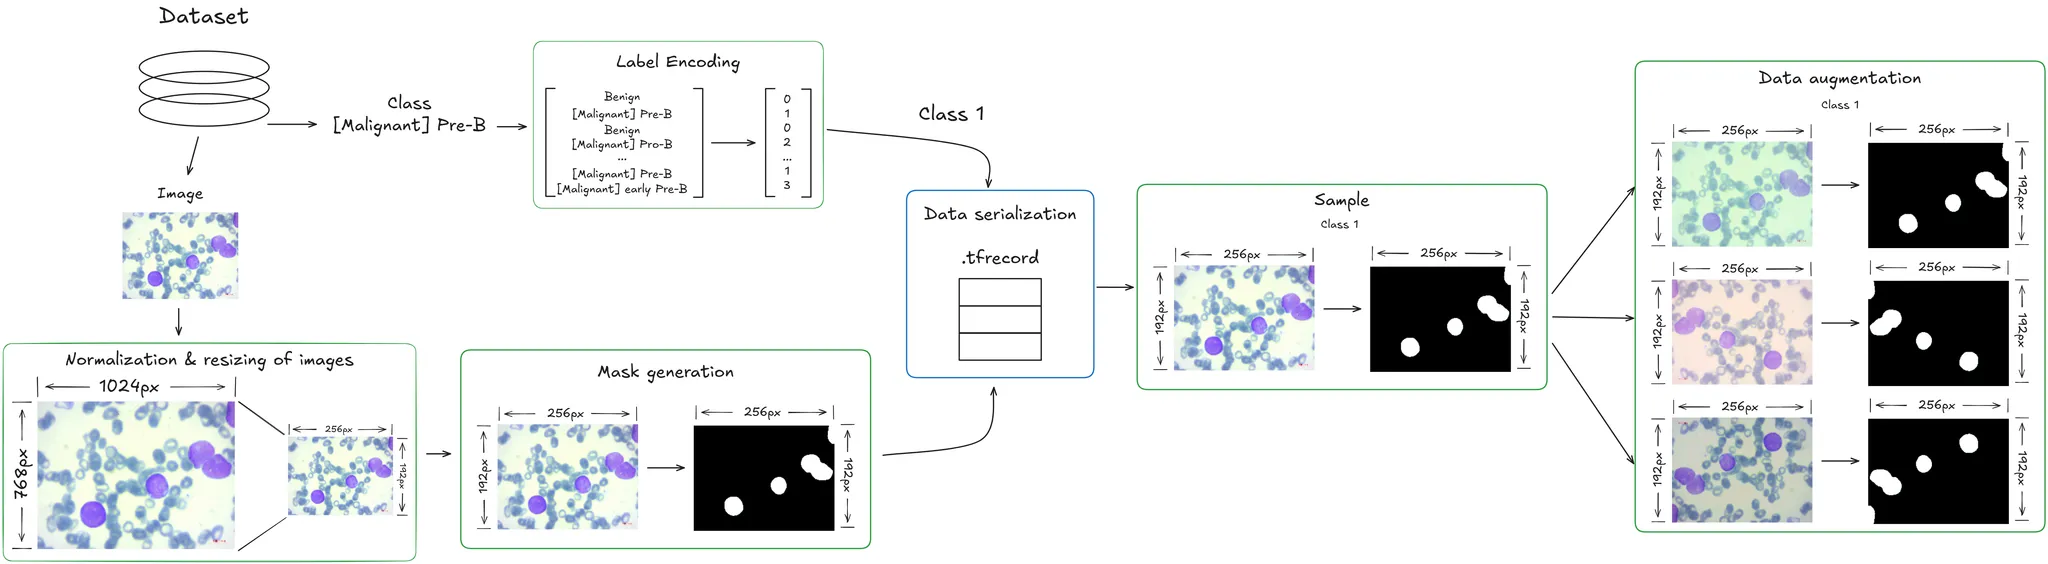
In this project, I used several preprocessing techniques:
- Image normalization and resizing: All images were resized to a consistent shape and format, ensuring uniformity in the number of channels and making them easier to process with neural networks.
- Class encoding for multiclass classification: The labels associated with each image were encoded using suitable techniques so that classification algorithms could correctly interpret them in a multiclass setting.
- Mask generation for semantic segmentation: Since the original dataset did not include segmentation masks, a custom script was developed to generate binary masks. This process relied on converting images to the LAB color space, specifically focusing on the a channel, which distinguishes red and green hues. This helped in identifying cell nuclei more effectively.
- Efficient serialization with TFRecord: To enable fast and structured data loading during training, the dataset was stored using the TFRecord format, widely used in TensorFlow environments for its performance advantages.
- Data augmentation: Various augmentation techniques were applied, including:
-
Rotations
-
Flips
-
Brightness variations
-
Contrast variations
-
Saturation level changes
-
These augmentations increased the diversity of the training set and helped improve the model’s generalization ability.
Model development
For this project, I developed and trained two different models, each designed for a specific task. Additionally, I explored a unified multitask learning approach.
Classification
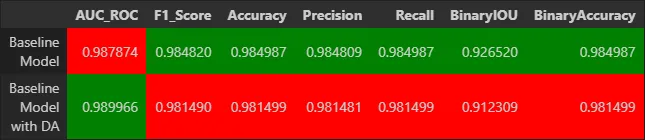
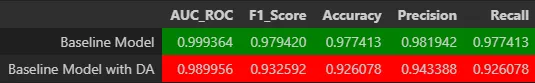
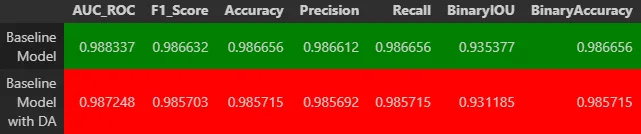
Convolutional neural networks (CNNs) were trained to identify the cell type in each image. Three main approaches were compared: a baseline model, a model with data augmentation, and a model based on transfer learning using the pre-trained VGG16 architecture.
Baseline Model
The first was a baseline model built from scratch. A custom CNN architecture was designed with convolutional, pooling, and fully connected layers, and was trained from scratch. This model served as a baseline for comparison.
Improved Model with Data Augmentation
The baseline model was enhanced by incorporating data augmentation techniques.
Model Based on Transfer Learning
The third model is based on transfer learning using the pre-trained VGG16 architecture. I leveraged VGG16 deep feature extraction capabilities. The convolutional layers were kept as a feature extractor, and new dense layers were added for classification specific to this task.
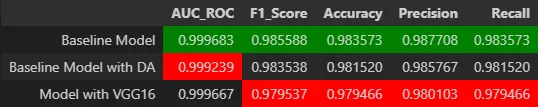
The models were evaluated using metrics like accuracy, F1 score, and AUC. Results showed accuracy above 98% and an AUC of 0.9997, demonstrating excellent performance in the classification task.
Segmentation
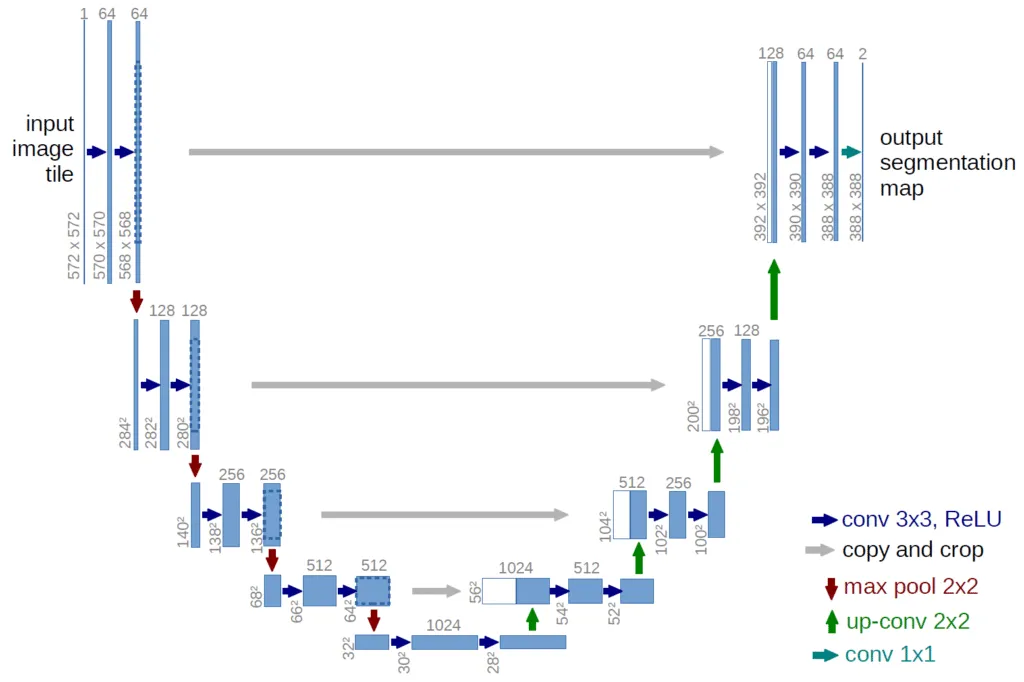
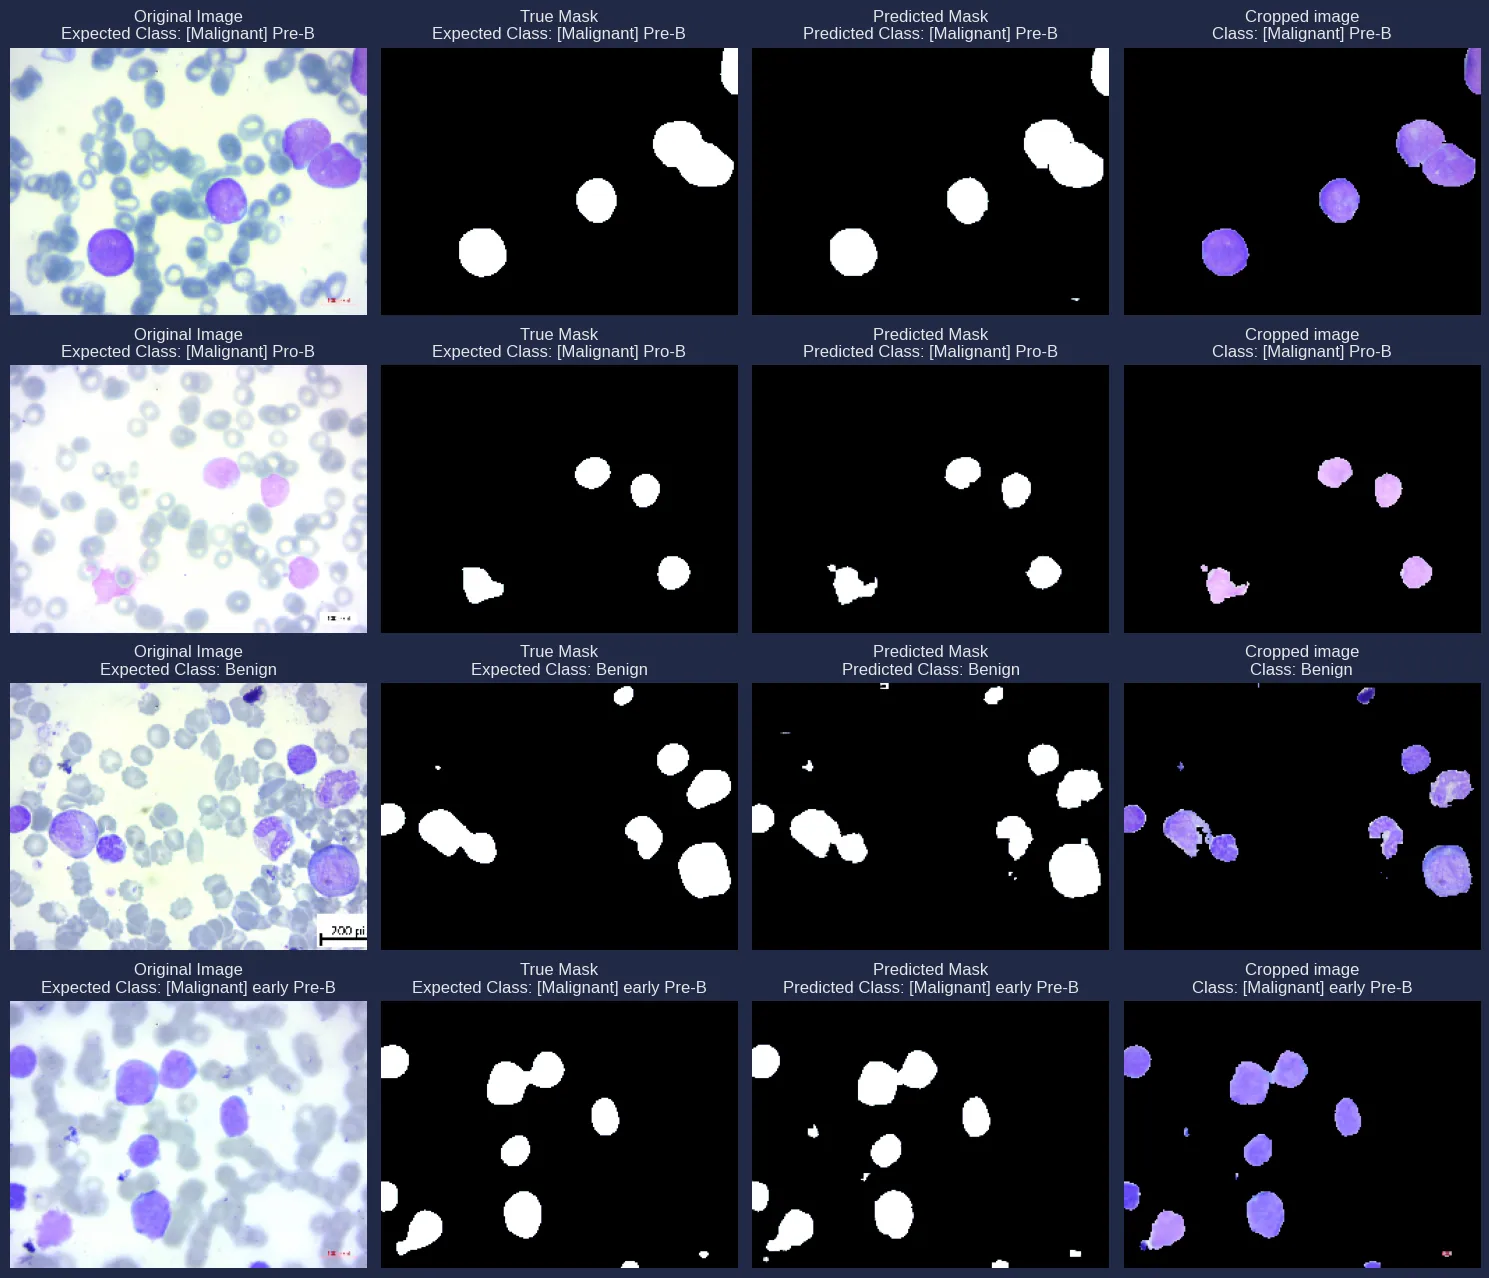
In addition to classifying cells, I developed a semantic segmentation model to identify specific regions of lymphoblasts in images. I modified the U-Net architecture from the original paper by Ronneberger et al. for this task. An encoder-decoder structure, similar to U-Net but without skip connections, was used and trained with paired images and binary masks. Techniques such as class balancing and data augmentation were applied to enhance the model’s robustness.
The results were very good, with a mean IoU of 0.93 and pixel-wise accuracy of 98.5%.
Combined architecture
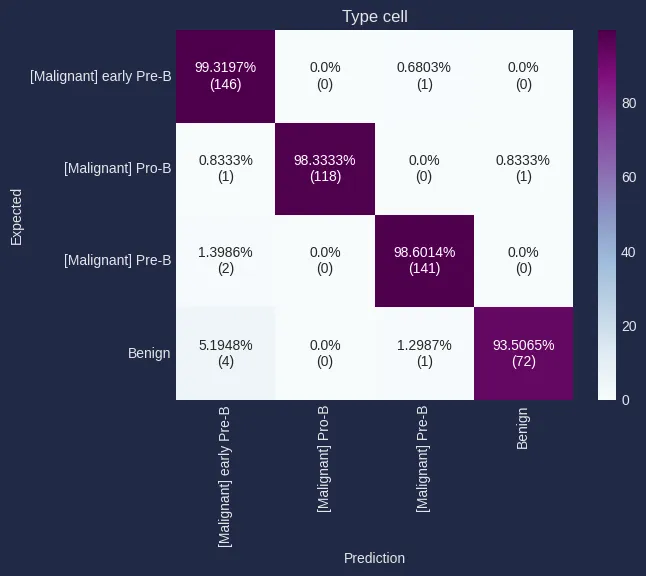
In the final stage, both tasks were integrated into a multitask architecture capable of performing classification and segmentation simultaneously. This approach resulted in a more efficient and coherent system by leveraging the intersection between the two tasks.
- Classification metrics: The combined model achieved an AUC of 0.9993. A confusion matrix was also generated to analyze classification errors among cell subtypes.
- Segmentation metrics: The multitask model achieved a mean IoU of 0.935.
Finally, some examples of the model’s predictions can be visualized, showing both class predictions and segmentation overlays.
System deployment
The solution was designed to be easily deployable, both locally and in more complex production environments. A web service was implemented using Flask as the main framework and Waitress as the WSGI server, allowing the model to be exposed via a simple local prediction API. The trained model was packaged in a Docker container, ensuring portability, version control, and easy distribution.
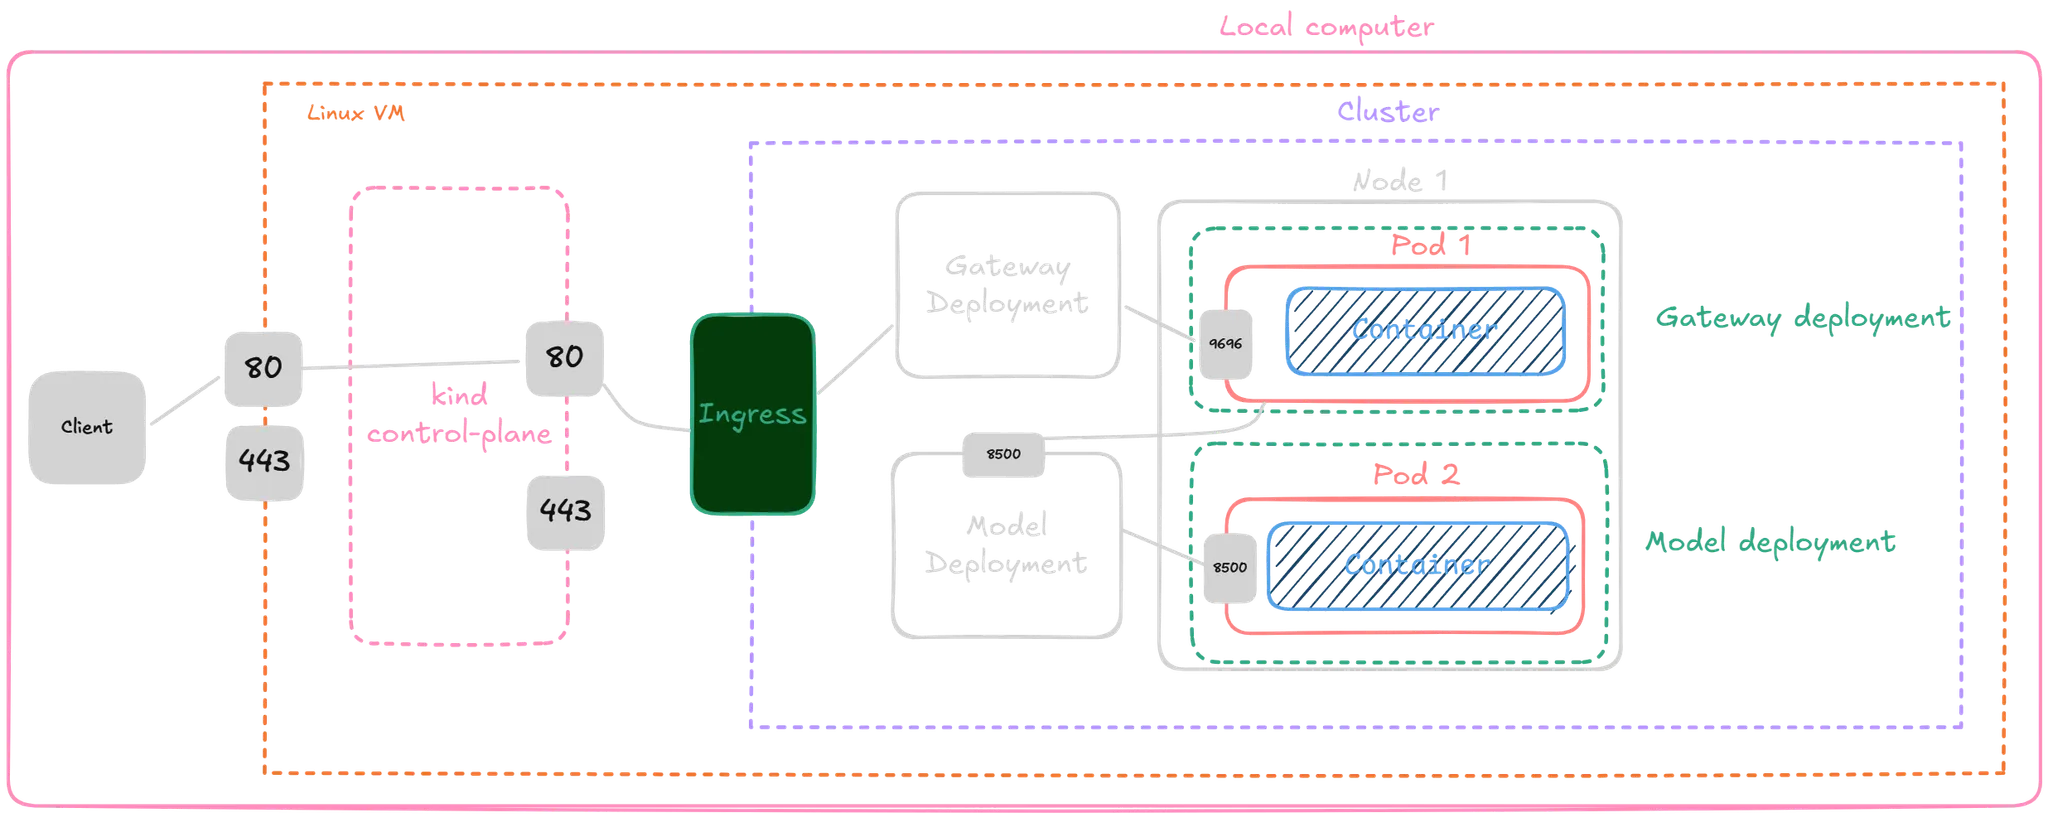
To enable efficient and scalable inference, TensorFlow Serving was used as a specialized server for machine learning models. The entire system was orchestrated using Kubernetes with Kind, and components were configured using declarative YAML files to manage services, deployments, load balancers, and ingress controllers.
Lastly, an interactive web interface was developed using Streamlit, allowing any user to upload a microscopic image and instantly receive both the predicted class and a visual segmentation of the affected regions. This makes the model accessible even to users without technical knowledge, making it applicable in real-world clinical and lab environments.
Conclusion
This project was made possible by the solid theoretical and practical grounding I gained in ML Zoomcamp, led by Alexey Grigorev and the DataTalksClub community. The course provided a clear, structured path, from core machine-learning fundamentals to pipeline design and model deployment.
Crucially, it provided me with hands-on experience in preparing and validating datasets, selecting suitable models, and rigorously evaluating their performance. Those skills directly enabled the end-to-end system presented here.