Background
There’s a specific part of job-hunting that I look forward to. It’s called take-home assessments. These assignments are a great way to learn about what you would do in the company on a typical day. As a data scientist, it gives me immense joy to take a sneak peak into what kind of data I’d be working with. It helps me judge a company’s attitude towards its data science initiatives too!
Towards the end of my master’s course, I started applying for jobs. One of the most interesting projects I did was from a gaming company.
Introduction
They asked me to perform customer segmentation for their in-game marketing campaign.
I was given a user level dataset and the attributes showed user’s purchase date for the base game, expansion packs and downloadable content of the game. That was it!
When I first saw the data, I thought, really? What can I do with merely these attributes!?
Turned out, more than I could initially think! Not only I figured a way of doing an RFM Analysis, I managed to take it up a notch. I call it Customer Segmentation 2.0!
Oh and, in case you didn’t know, RFM stands for Recency, Frequency and Monetary value. An RFM analysis is a generally accepted method for customer segmentation. For the purpose of this article, I would not dive into details of RFM analysis, as there are already many such resources available. My focus is to explain what I did for this particular project.
So let’s start, shall we!?
The data
Let’s take a quick look at the available features.

Snapshot of available features used for segmentation: base game, expansions, and DLC install dates
So the last 8 features are the names of either an expansion pack of the game or a downloadable content. The dataset has 500k rows. That’s good because it means we can make more segments, right!?
The Methodology
I begin by studying the distributions or unique value counts of each of the feature. This helps me get familiar with the data. There are a lot of blanks in the data, considering not many players install an expansion pack or downloadable content. I replace such values with -1.
I translate all other dates to number of days passed since the game was launched. This makes the data numeric.
In other words, I convert all the install dates to numeric by counting number of days passed at the date of installing since the game was launched. That is, the days between install date and game launch date. This puts all the dates in perspective.
I tag the users as responders or non-responders based on whether they buy any add-on or not. For responders, I intend to use k-means clustering for segmentation.
Now I can begin defining my key metrics for segmenting the responders:
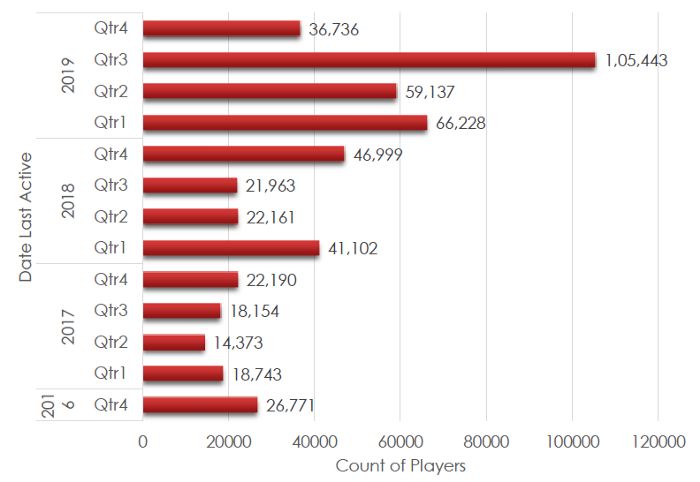
Recency metric: days since last activity, highlighting more recent engagement in 2019
Recency
This is the number of days passed since the user was seen active on the gaming platform.
The chart shows that more users have been active in 2019, as compared to the users in 2017.
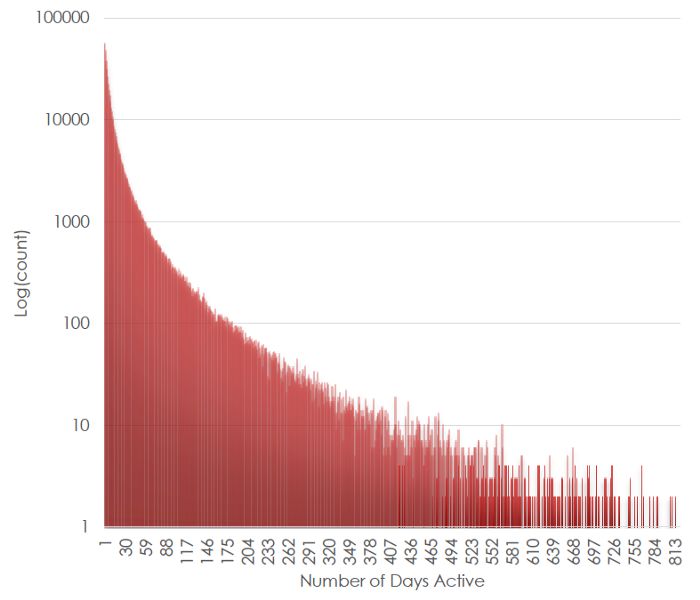
Frequency metric: number of active days since install, skewed toward fewer days for most players
Frequency
Since the day a player installed the game, how many days did he play the game?
The chart is concentrated towards left, meaning that most players are active for lesser days. However, it should be noted that new players have less number of days where they could be active, as compared to older players.
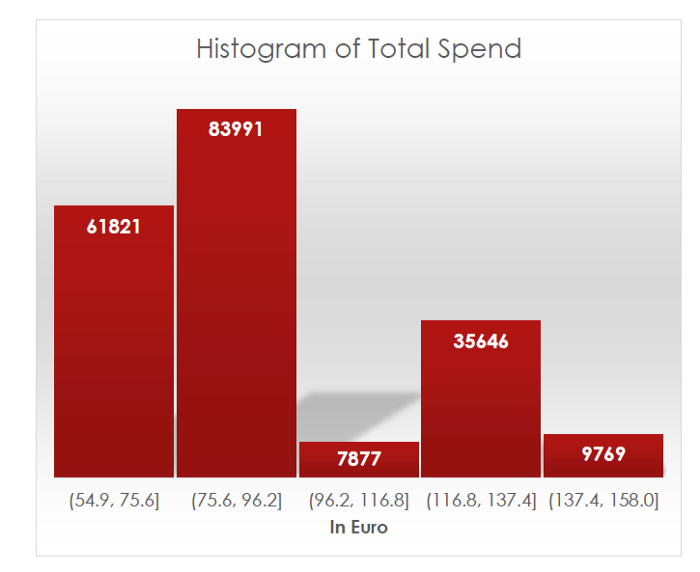
Monetary value metric: spend estimated by mapping store prices to user add-on purchases
Monetary Value
Since this information is not available in the data, I went to the game store website and mapped the prices to the add-ons. This way, I now have the amount spent by each player. Neat, eh!?
Most players spend less than a hundred bucks. This is expected because the base game costs 55 bucks. And the downloadable content is generally cheap!
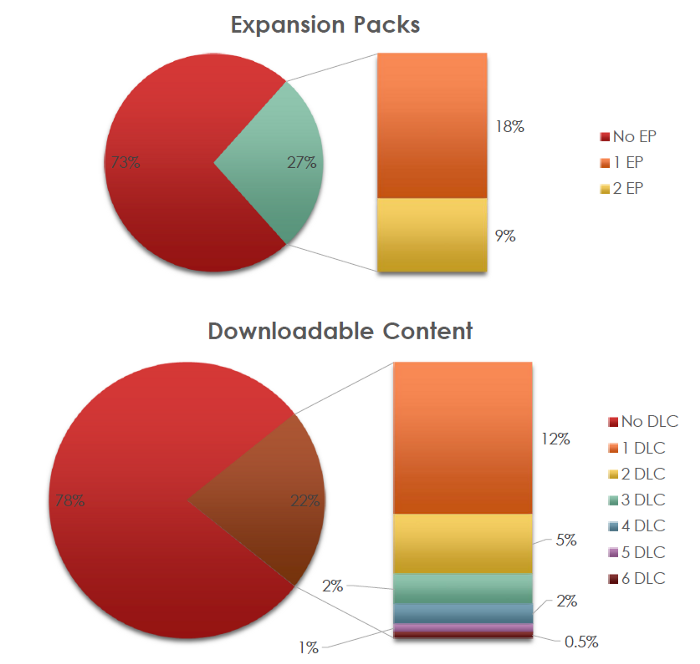
Responses metric: count of prior add-on purchases per player; most buyers purchase only one
Responses
How many add-ons did the player buy previously? This will not be correlated with the monetary value, because the prices vary across add-ons!
It can be seen that most people who bought any add-on, only bought one.
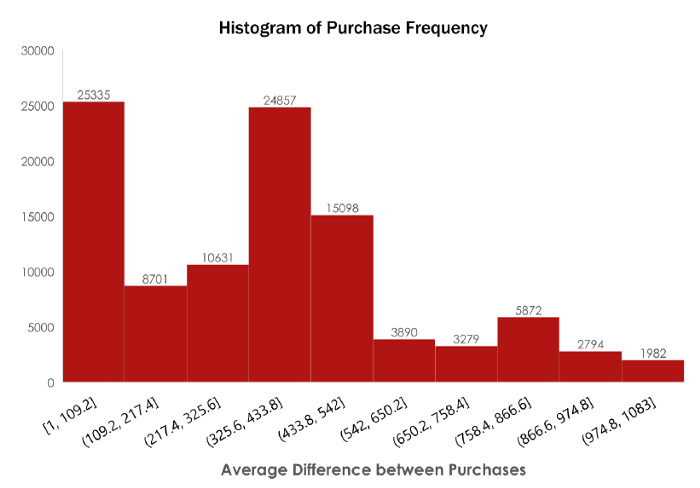
Purchase frequency metric: intervals between purchases with peaks around expansion release periods
Purchase Frequency
Maybe the player buys everything together, or maybe he spreads it out?
While most players buy everything soon after they buy the game, we see other highs near 400 days and 800 days. Incidental? No! These bumps can be attributed to launch dates of the two expansion packs roughly every year.
Clustering/Segmenting The Responders
Using the 5 key metrics, I apply k-means clustering to segment the users.
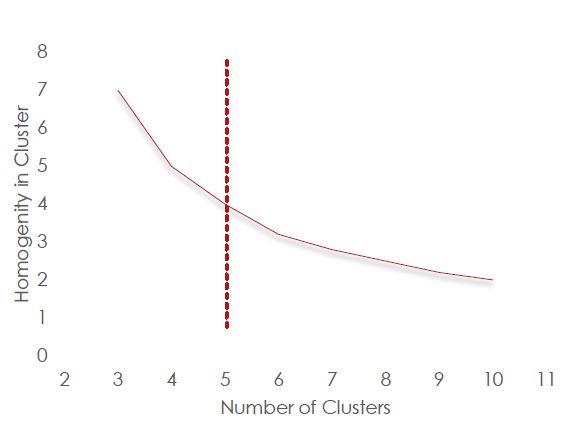
Elbow plot suggests k=5 as a balanced choice for k-means clustering complexity and cohesion
Looking at the chart, I select 5 as the optimum number of clusters/segments. This gives me a balance between homogeneity within clusters and complexity of the analysis.
Segmenting The Non-Responders
Since these are the users who have not interacted much, we only have two measures to judge them: Recency and Frequency.
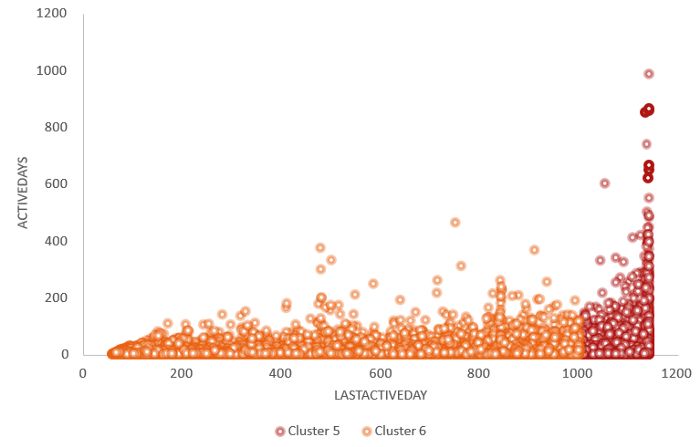
Non-responder segmentation using a recency threshold to separate recently active from lapsed users
As can be seen in the above chart, I segment such users by a threshold of 1000 days. That is, those who have been active in last 200 days are in Cluster 6, others are in Cluster 5 (Cluster 0–4 being the responders).
Analysis and Strategy
Following table gives means of all the features across the user segments.

Summary statistics by segment for recency, frequency, responses, monetary value, and purchase cadence
Look at the first row. On average, players in Cluster 0 were active for nearly 15 days, bought 1.5 add-ons, were active 477 days from the beginning (long back), spent 65 bucks, and purchased an add-on every 33 days. Since these were active long back, they have probably forgotten about the game. So, in-game marketing may not work on them! On the other hand, email marketing might!
Now look at the second row. On average, players in Cluster 1 were active for a whopping 92 days, bought nearly 3 add-ons, were active fairly recently, have spent much more than others have, but purchase relatively rarely. These could be the players who have recently bought an add-on. These are the customers who seem to be loyal. We could target them with more exciting features!
Following figure gives similar summary of each cluster/segment.
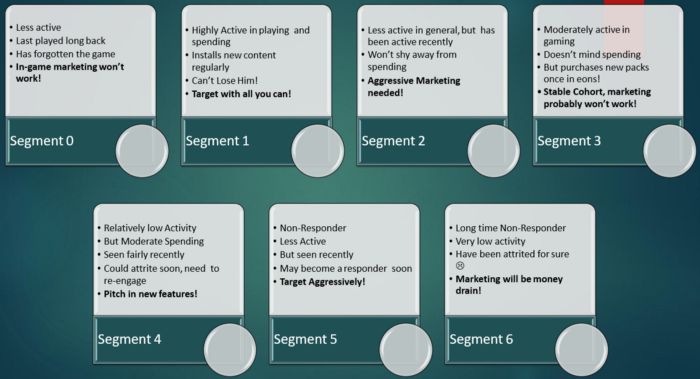
Actionable strategy guidance for each segment to tailor in-game and email marketing
Conclusion
In this article, I presented my methodology of attacking a customer segmentation problem with limited data. I utilized all that was available, and instead of a more popular RFM analysis, I performed a 5-d segmentation.
The analysis resulted in 7 customer segments. These segments consist of users with similar behaviour. Looking at their behaviour across metrics helps in targeting them with custom advertisements.
Hope that helps!
Find a detailed explanation in my YouTube video:
- Here’s my GitHub repo with the data and code.
- Connect with me on LinkedIn!
- Check out some of my cool projects on GitHub!